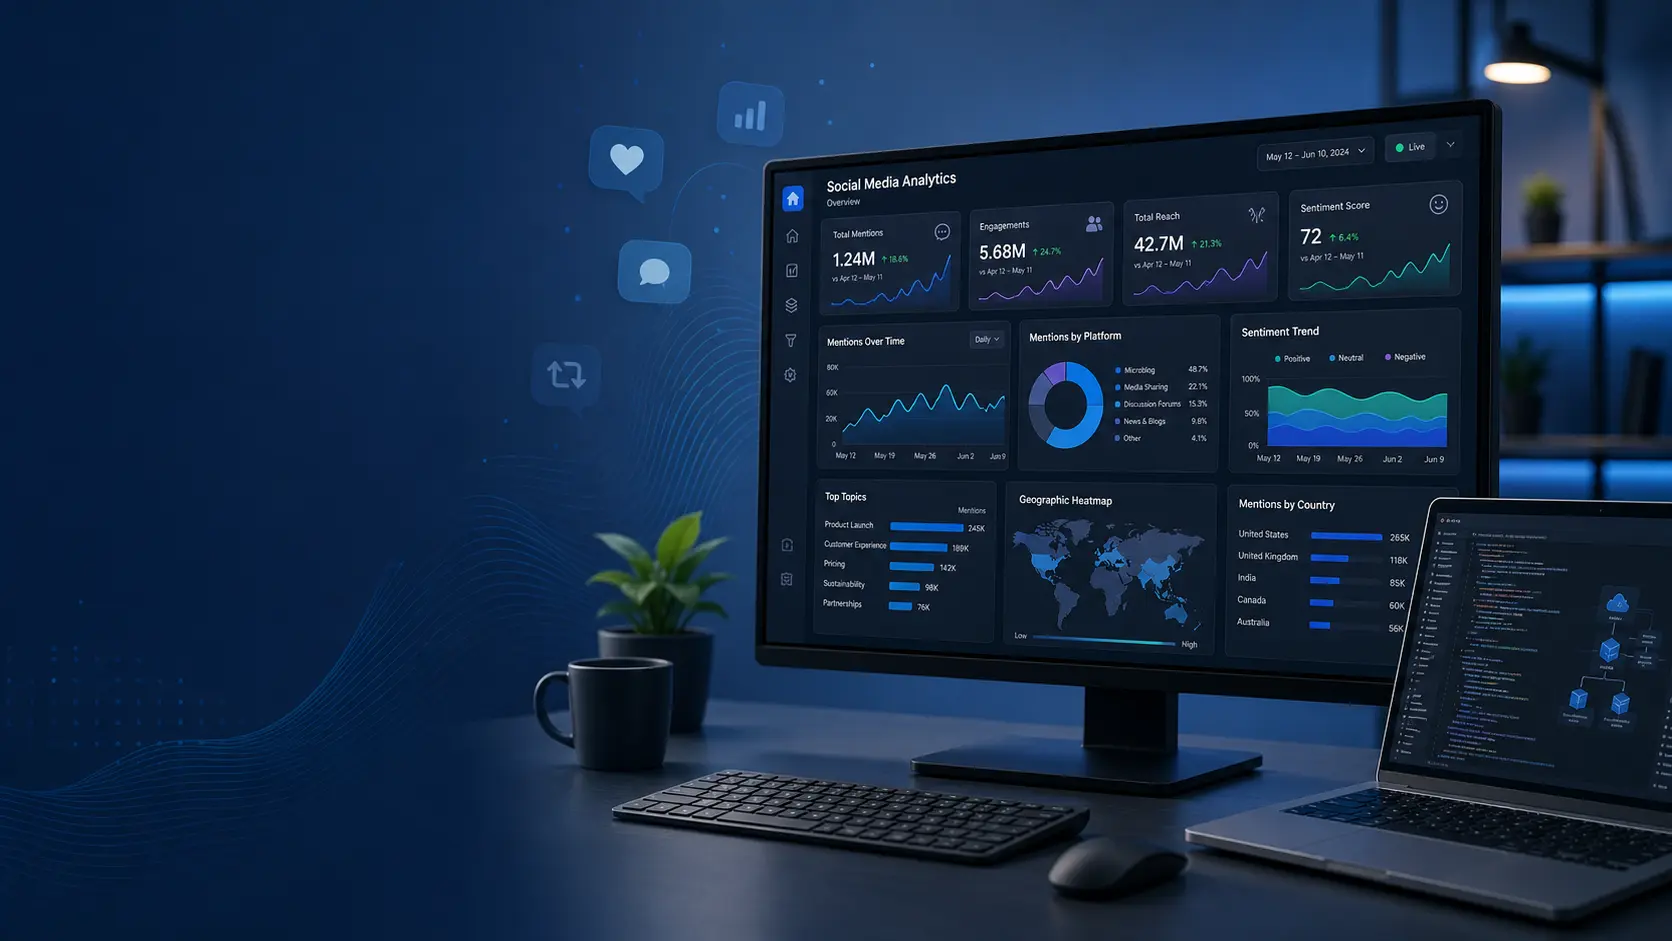
The Problem
Social media performance is only as useful as how quickly it can be understood and acted on. Previously, each reporting cycle meant logging into several platforms, exporting CSVs, cleaning the data and rebuilding the same charts from scratch. Small differences in naming or timing between platforms created discrepancies, undermining confidence in the numbers.
As the volume of content grew, this manual process became a bottleneck. Reports lagged behind reality, ad-hoc questions were hard to answer, and a lot of highly skilled time was being spent downloading files rather than interpreting what the data was saying.
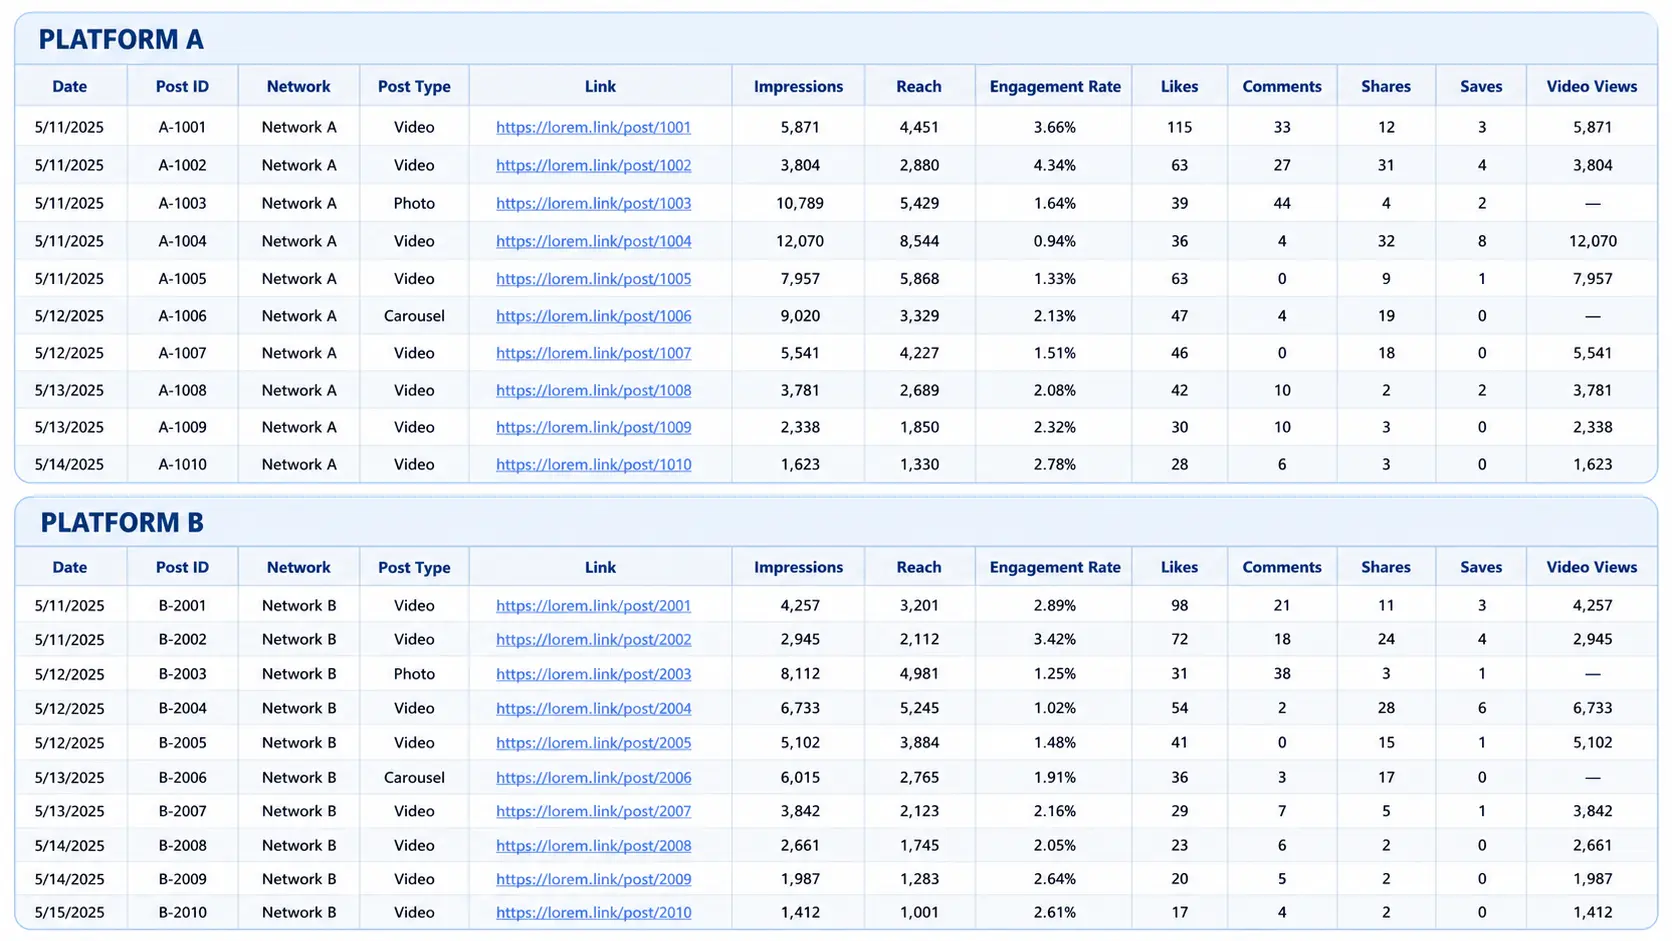
Before: fragmented, manual spreadsheet reporting across multiple platforms and spreadsheets. (Mock data) Click to enlarge.
The Approach
A hybrid, cloud-based ETL pipeline was implemented with Google BigQuery as the central warehouse. Custom Python jobs handle platforms that offer robust API access, while an approved marketing data connector manages data from platforms with stricter app approval processes. A live Google Sheets template is connected as an external table for niche metrics that simply are not available via APIs.
This setup delivers automated coverage for all standard metrics, while still allowing for precise manual inputs where necessary. Once data lands in BigQuery, SQL views standardise the schemas, calculate engagement rates and apply internal tagging logic so all reporting draws from a single, consistent model.
"Always-on" extraction for each platform
Meta and YouTube data is collected by scheduled Python scripts that authenticate via their official APIs, fetch post-level metrics and write them directly into raw BigQuery tables.
TikTok data is ingested through an approved connector, which avoids lengthy app approvals and streams detailed reach and engagement metrics straight into the warehouse.
Manual but critical data points such as certain save or bookmark interactions are captured via Google Sheets, which behaves like a live table inside BigQuery.
The integration layer connecting data and dashboards
The warehouse is designed with separate raw and transformed layers, making it easy to adapt to API changes without breaking reports. A master SQL view joins data from all sources, cleans field names, aligns date logic and calculates cross-platform KPIs such as engagement rate per reach.
This view feeds directly into business intelligence tools such as Looker Studio or Power BI, where branded dashboards present performance in a way that is easy to slice by channel, time period, campaign or content type. Role-based access ensures that different teams see the metrics that matter to them without exposing unnecessary detail.
Tech stack
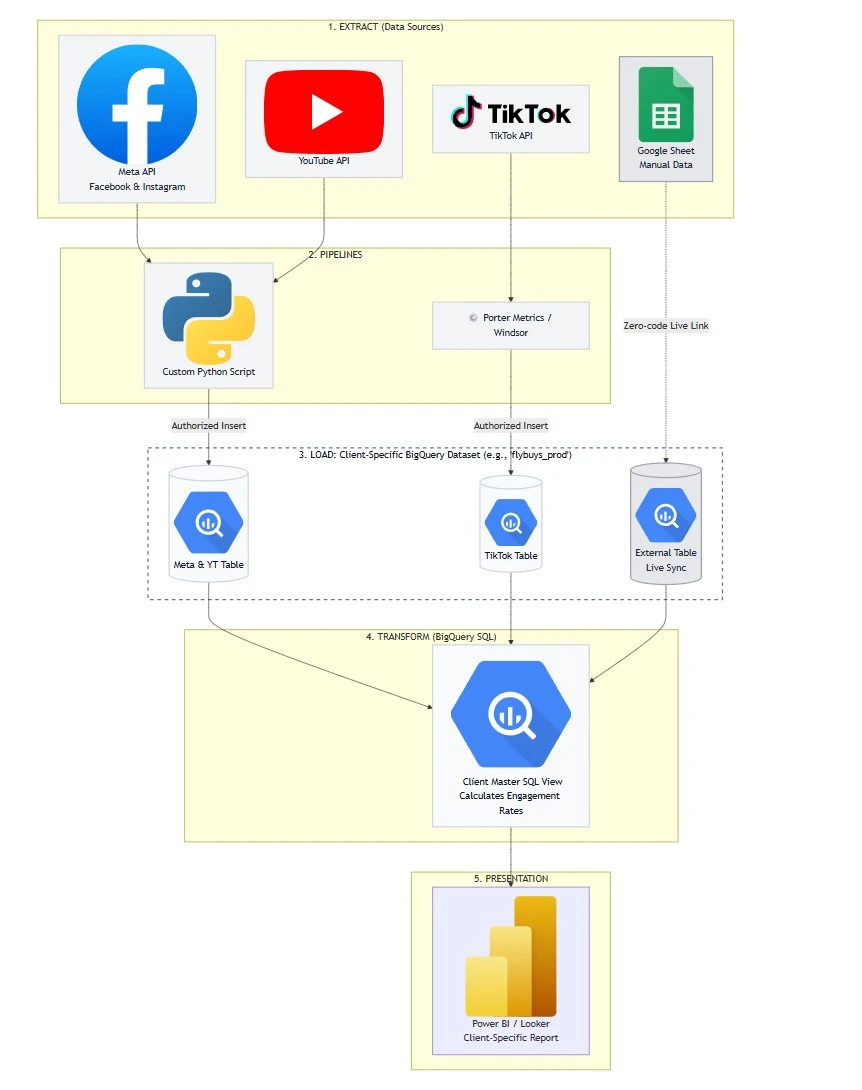
The central warehouse model that powers live social dashboards. Click to enlarge.
The Results
With the ETL pipeline live, social performance data now flows into BigQuery on a schedule, and dashboards update automatically. Reporting cycles that used to take several days of exports and formatting now take minutes, with most of the work happening in the background.
Stakeholders can open a dashboard at any point in the month and see current numbers across all social channels in one place. Granular post-level data is still available for deeper dives, but teams no longer need to reconcile slightly different figures between decks. The same architecture has already been used as a template for additional brands, significantly reducing the time to onboard new reporting requirements.
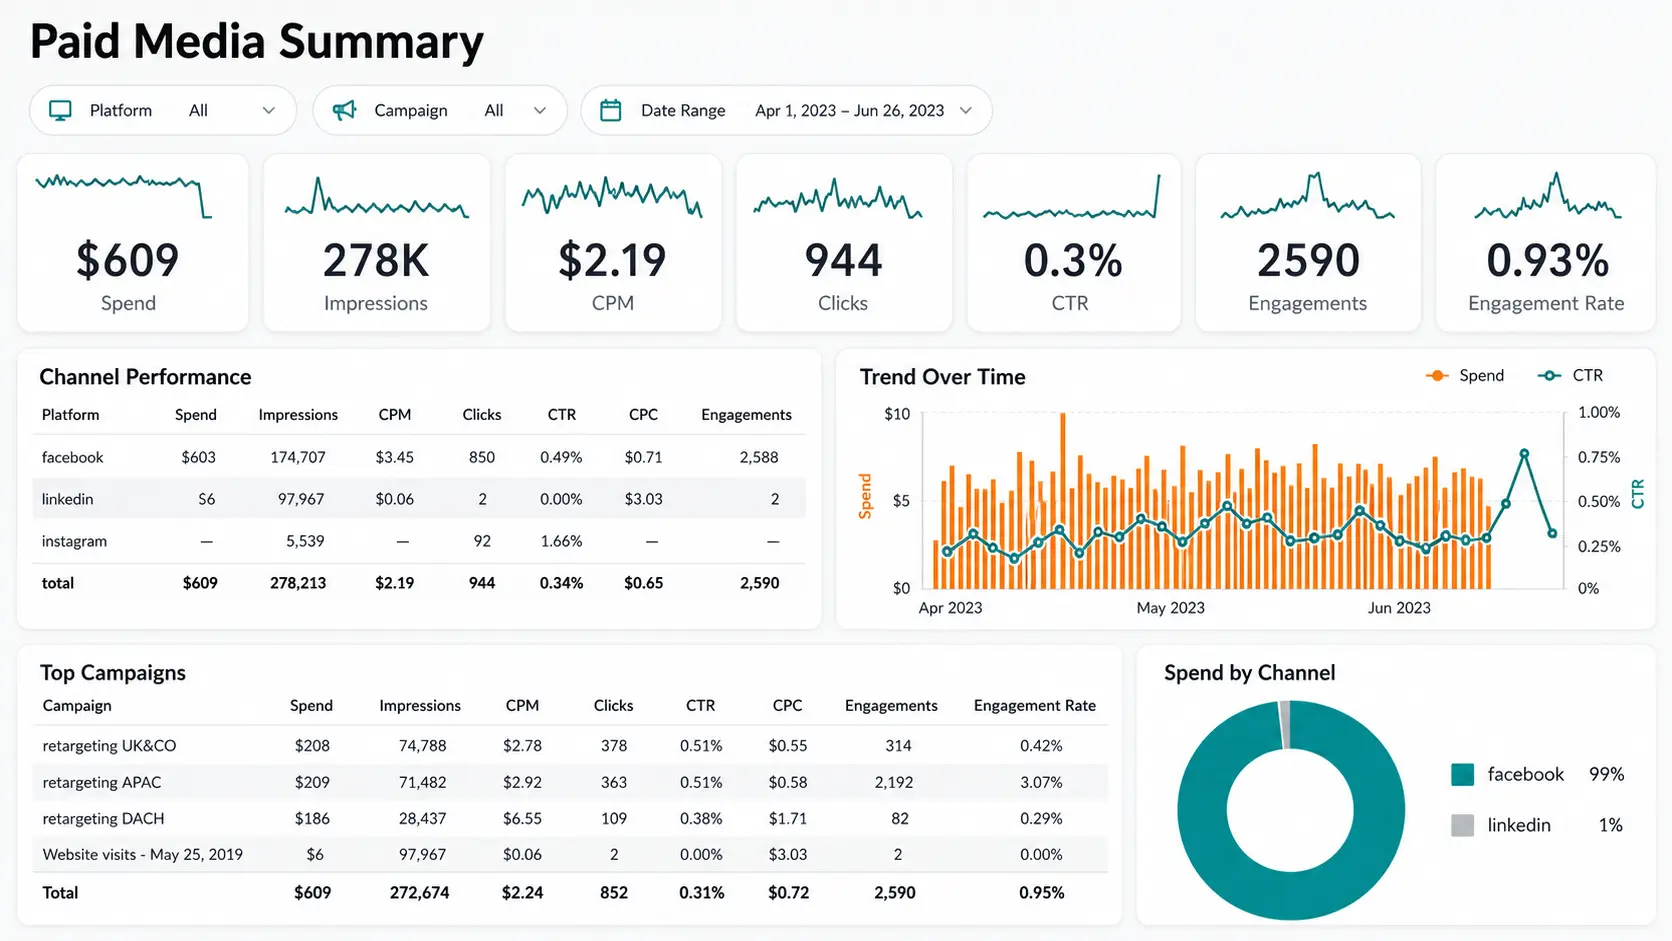
After: a single, trusted dashboard for all social performance, updated automatically. (Mock Data)
How this connects to the services offered
This project brings together:
- Design and implementation of bespoke ETL pipelines for social and marketing data.
- Cloud data warehousing and SQL modelling for reliable, long-term reporting.
- Dashboard design in Looker Studio and Power BI, aligned to internal and client needs.
- Advisory on when to use APIs, connectors or manual tables to fill gaps in platform data.
The same pattern can be adapted for other channels such as paid media, web analytics or CRM, building towards a broader marketing data platform rather than isolated reports. See BigQuery, PowerBI & Looker Studio Dashboard Consulting for the managed service offering, or Get Your Data Ready for AI for the pre-packaged pipeline.